Polaris Announces Q1 2016 Financial Results
May 5, 2016
VANCOUVER, British Columbia - Polaris Materials Corporation (TSX:PLS) (the "Company" or "Polaris") today reported the financial results for its first quarter ending March 31, 2016. All currencies are US dollars unless otherwise noted.
HIGHLIGHTS
- Long Beach has trended ahead of our initial sales expectations, with the recent completion of the Oceanwide Plaza foundation pour and ongoing daily deliveries for several large projects contributing to Q1 sales
- Q1 2016 sales volumes (as noted in our April 13, 2016 press release) were lower than Q1 2015 levels by 28% while Q1 2016 revenues declined 24% versus the prior year quarter as a result of heavy rainfalls and planned maintenance at a customer delivery point
- Shipments in April 2016 were approximately 382,000 tons, a significant improvement over March, and are consistent with our expectations for the full year
- Net loss in Q1 2016 was $2.5 million compared to income of $0.1 million in Q1 2015, driven primarily by the above noted decline in volumes
- Revenue per ton increased to $15.41 per ton in Q1 2016 from $14.64 per ton in Q1 2015 due to changes in sales mix and underlying price increases, offset in part by the impact of reduced fuel surcharges
- An exploratory drilling program for the Black Bear project was completed in the first quarter of 2016 and results will be incorporated in a National Instrument 43-101 report expected in mid 2016
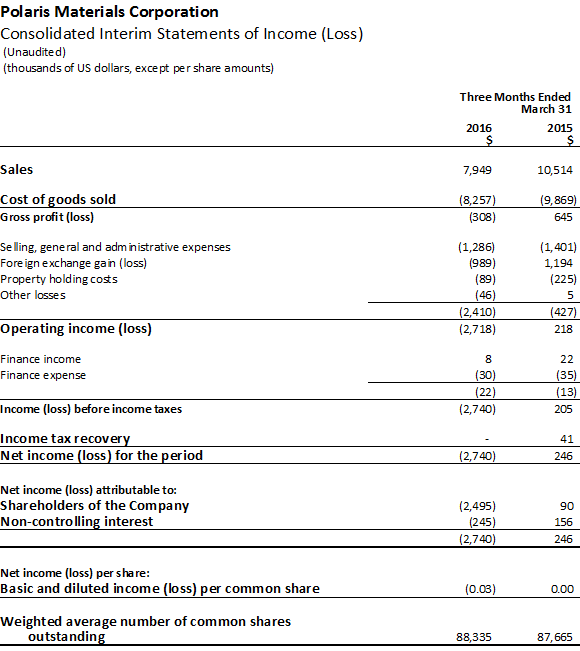
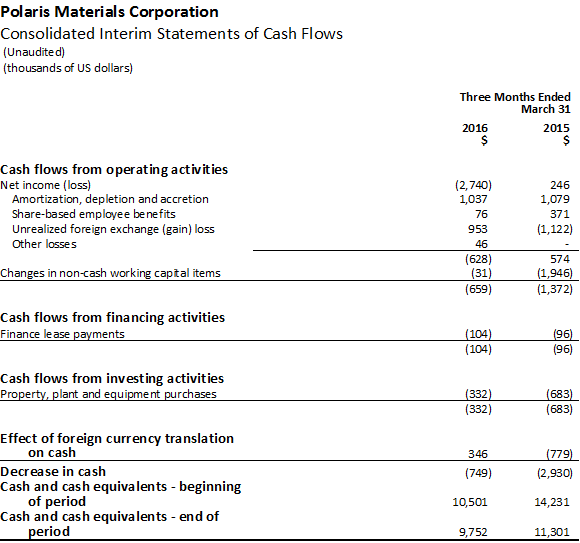
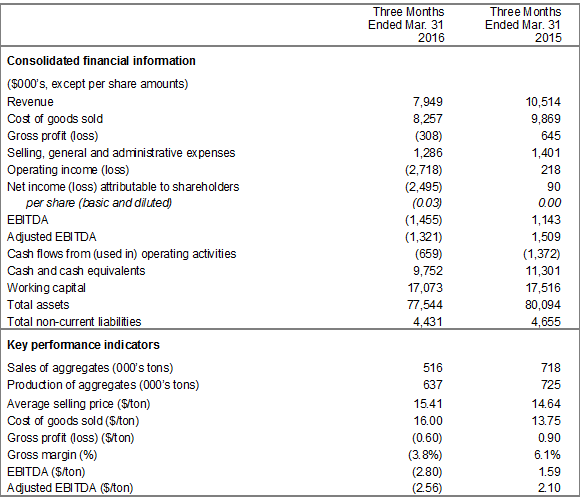
Sales of aggregates in the first quarter were 516,000 tons with revenue of $7.9 million, 28% and 24%, respectively, below the same quarter in 2015. Cost of goods sold declined to $8.3 million in Q1 2016 from $9.9 million in the prior year quarter, attributable primarily to the reduction in volumes, offset by an increase in costs attributable to changes in sales mix. In spite of the expected decline in volumes, we reduced cash used by operations during Q1 2016 to $0.7 million from $1.4 million used in Q1 2015.
Ken Palko, President and CEO, commented: "In spite of headwinds driven by unusually wet weather and planned maintenance, we are pleased that we were able to manage costs and reduce cash utilization during the seasonally slow first quarter, while continuing to pursue business development activities that will set us up for success later this year. We are very pleased with the initial progress we are seeing from our Long Beach terminal and continue to be excited about the opportunity to develop Black Bear. We are rapidly progressing our evaluation work on this exciting development project and aim to share the findings by mid 2016."
Summary of Quarterly Results
The selected financial information set out below is based on and derived from the unaudited consolidated financial statements of the Company. For a more detailed table of quarterly results please refer to our Q1 2016 MD&A, which can be found on SEDAR or the Company's website.
First quarter 2016, compared to 2015
Sales of aggregates
Aggregate sales for the first quarter of 2016 of 516,000 tons were a 28% decrease over 2015. Sales volumes in Q1 2016 were modestly below our expected range of 550,000 to 600,000 tons. Heavy rain in our key markets, as well as scheduled maintenance at one of our Bay Area delivery points impacted volumes. On May 3, the largest aggregate producer in California reported to shareholders that "California shipments fell more than 10 percent [in Q1 2016] from the prior year … wet weather negatively impacted shipments." Sales at Long Beach were better than expected during the quarter and when combined with expectations for several large orders early in Q2, necessitated re-allocating volume from immediate sales to restocking inventory at the Long Beach terminal. Total sales volumes in March 2016 were strong at approximately 314,000 tons which is consistent with our monthly volume expectations for the full year.
Revenue and pricing
Revenue for the first quarter of 2016 decreased by 24% to $7.9 million, compared with $10.5 million in 2015. Despite lower than expected volumes, revenue benefited from positive sales mix with a higher proportion of sales delivered to San Francisco plus the introduction of sales delivered into Long Beach, which both include freight charges as opposed to those sold ex-quarry. Average selling price ("ASP") during the first quarter of 2016 of $15.41 per ton increased $0.77 per ton from $14.64 per ton in 2015. Compared with 2015, price variance was a favorable 1% due to price increases, offset by an unfavourable variance of 4% due to a reduction in fuel surcharges. A favorable sales mix variance of 6% was due to increased sales to customers with delivered pricing, including our Long Beach terminal.
Cost of goods sold
Cost of goods sold in the first quarter 2016 decreased by 16% to $8.3 million, compared with $9.9 million in 2015. Cost of goods sold per ton in Q1 2016 increased to $16.00 compared to $13.75 in Q1 2015. Lower than expected volumes reduced overall cost of goods sold, however, fixed costs applied to lower tonnage, higher delivery costs due to increased sales mix to customers that include freight, plus the strengthening of the Canadian dollar (as quarry costs are incurred in Canadian dollars and translated in US dollars for reporting purposes) contributed to higher costs on a per ton basis.
Gross profit (loss) and gross margin
The gross loss for first quarter of 2016 was $0.3 million or $0.60 loss per ton, compared to a gross profit of $0.6 million or $0.90 per ton in 2015. As noted above, the decline is largely due to lower volumes and less favourable foreign exchange rates.
Selling, general and administrative costs
During the quarter ended March 31, 2016, selling, general and administrative ("SG&A") expenses were $1.3 million, including $0.1 million of non-cash stock based compensation, compared with $1.4 million, including $0.4 million of stock based compensation, during 2015. SG&A (net) increased versus the prior year quarter due to the impact of foreign exchange. SG&A during 2016 was 16.2% of sales compared to 13.3% of sales during 2015. Net of non-cash charges for stock based compensation, 2016 SG&A represented 15.2% of sales compared with 9.8% last year. The increase in SG&A (net) as a percent of sales was similarly a result of foreign exchange and lower sales volumes during the quarter.
Net income (loss)
The net loss attributable to shareholders during the quarter ended March 31, 2016 was $2.5 million ($0.03 per share loss) compared to a net profit attributable to shareholders of $0.09 million ($0.00 per share, net profit) during the quarter ended March 31, 2015. The results this quarter were principally attributable to the lower volumes and the significant effect of foreign exchange losses in the current quarter. These foreign exchange losses are a function of U.S. dollar receivables held by Orca Quarry, which has a Canadian dollar functional currency, owing from the Company's U.S. subsidiary, Eagle Rock Aggregates.
EBITDA and Adjusted EBITDA
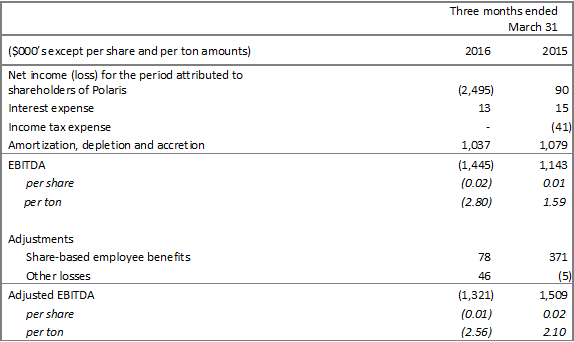
Adjusted EBITDA and EBITDA for 2016 also declined over year-on-year comparatives (see Non-IFRS Measures for details). Before adjusting for share-based employee benefits, EBITDA for the first quarter of 2016 of negative $1.4 million ($2.80 loss per ton) declined $2.6 million over the prior year comparative of $1.1 million ($1.59 per ton). Similarly, Adjusted EBITDA of negative $1.3 million ($2.56 loss per ton) declined $2.8 million over the prior year comparative of $1.5 million ($2.10 per ton).
Segmented analysis
The Company operates in one segment: the development and operation of construction aggregate properties and projects located in the western North America.
Selling price and fuel surcharge indices
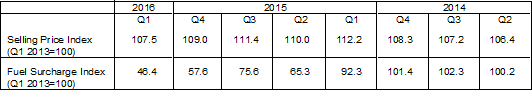
In the first quarter of 2016, the quarter-on-quarter average delivered selling price decreased by 1.3% as a consequence of the pass through of lower shipping fuel surcharges from the fourth quarter of 2015, which reflected the decreasing trend in the world crude oil price during the period.
Seasonality
The Company's Orca sand and gravel quarry operates year-round, however, sales demand is seasonal due to the impact of poor weather conditions, particularly in the first (winter) quarter which have an impact on production volumes and demand for the Company's products. As a consequence the Company's financial results for any individual quarter are not necessarily indicative of results to be expected for that year. Sales and earnings are typically sensitive to regional and local weather, market conditions, and, in particular, to cyclical variations in construction spending.
CONFERENCE CALL AND WEBCAST DETAILS
The Company will host a conference call on Friday, May 6th, 2016 at 8:00 am Pacific Time (11:00am Eastern). Details to access the call live are as follows:
- Via telephone, toll free, by calling 1-888-390-0546 in North America or +1-416-764-8688 in Toronto.
- Via webcast at: http://goo.gl/D1Tj93
The webcast will be archived for 14 days following the call at the above-noted link. The conference call will also be recorded and available for replay until Friday, May 20, 2016. To access the replay, dial 1-888-390-0541 or +1-416-764-8677 and use Playback Passcode 859870# to hear the recording.
About Polaris Materials Corporation:
Polaris Materials Corporation is engaged in the development and operation of construction aggregate quarries in Canada to supply distribution facilities in the United States through coastal shipping. The Company's active construction aggregate interests consist of its Orca Sand and Gravel Quarry in British Columbia and two associated receiving terminals in Richmond and Long Beach, California. The Company also owns the Black Bear Project located in close proximity to the Orca Quarry, and a controlling interest in the Eagle Rock Quarry Project, located on the south coast of Vancouver Island.
For further information, please contact:
Nicholas Van Dyk
Vice President, Investor Relations and Corporate Development
Polaris Materials Corporation
Tel: (604) 915-5000 Ext. 111
info@polarismaterials.com
Cautionary Note Regarding Forward Looking Statements
This press release contains "forward-looking statements" and "forward-looking information" within the meaning of applicable securities laws. These statements and information appear in this document and include estimates, forecasts, information and statements as to management's expectations with respect to, among other things, the future financial or operating performance of the Company, including increases in gross margins, increases in sales volumes (including in the Long Beach market), shipments and selling prices, costs of production, capital and operating expenditures, requirements for additional capital, government regulation of quarrying operations, environmental risks, reclamation expenses, and title disputes, the Canadian dollar compared to the US dollar, increases in Californian construction activity and US infrastructure funding, statements regarding potential new customers and the development of Black Bear. Often, but not always, forward-looking statements and information can be identified by the use of words such as "may", "will", "should", "plans", "expects", "intends", "anticipates", "believes", "budget", and "scheduled" or the negative thereof or variations thereon or similar terminology. Forward-looking statements and information are necessarily based upon a number of estimates and assumptions that, while considered reasonable by management, are inherently subject to significant business, economic and competitive uncertainties and contingencies. Readers are cautioned that any such forward-looking statements and information are not guarantees and there can be no assurance that such statements and information will prove to be accurate and actual results and future events could differ materially from those anticipated in such statements. Important factors that could cause actual results to differ materially from the Company's expectations are disclosed in the Company's continuous disclosure documents which are filed with Canadian regulators on SEDAR (www.sedar.com), including under the heading "Risks and Uncertainties" in the Company's Annual Report and under the heading "Risk Factors" in the Company's Annual Information Form. Such factors include, amongst others, the effects of general economic conditions, changing foreign exchange rates and actions by government authorities, uncertainties associated with legal proceedings and negotiations, industry supply levels, competitive pricing pressures, mineral resource and reserve estimates and the timing and development of the Black Bear project. The Company expressly disclaims any intention or obligation to update or revise any forward-looking statements and information whether as a result of new information, future events or otherwise, except as required by applicable law. All written and oral forward-looking statements and information attributable to us or persons acting on our behalf are expressly qualified in their entirety by the foregoing cautionary statements.
Non-IFRS Measures
EBITDA and Adjusted EBITDA
EBITDA, adjusted EBITDA, EBITDA per share and adjusted EBITDA per share ("EBITDA Metrics") are non-IFRS financial measures. EBITDA and EBITDA per share represent net income, excluding income tax expense, interest expense and amortization and accretion. Adjusted EBITDA and adjusted EBITDA per share better reflects the underlying business performance of the Company by removing certain non-cash adjustments from its calculation of EBITDA and EBITDA per share. The Company believes that the EBITDA Metrics trends are valuable indicators of whether its operations are generating sufficient operating cash flow to fund working capital needs and to fund capital expenditures. The Company uses the results depicted by the EBITDA Metrics for these purposes, an approach utilized by the majority of public companies in the construction materials sector. The EBITDA Metrics are intended to provide additional information, do not have any standardized meaning prescribed by IFRS and should not be considered in isolation or as a substitute for measures of performance prepared in accordance with IFRS. These measures are not necessarily indicative of operating profit or cash flow from operations as determined under IFRS. Other companies may calculate these measures differently.
The following table reconciles these non-IFRS measures to the most directly comparable IFRS measure.