Polaris Announces Q3 2016 Financial Results
November 8, 2016
VANCOUVER, British Columbia – Polaris Materials Corporation (TSX:PLS) (the “Company” or “Polaris”) today reported the financial results for its third quarter ending September 30, 2016. All currencies are US dollars unless otherwise noted.
Q3 2016 HIGHLIGHTS
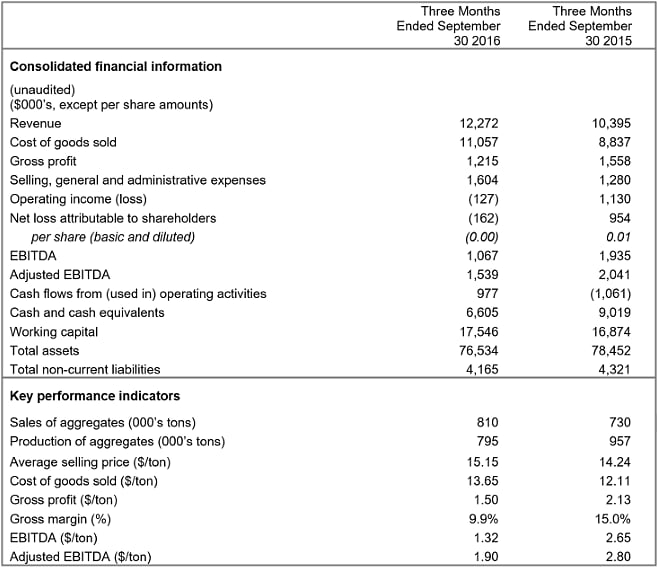
- Sales were 810,000 tons, an increase of 11% over Q3 2015, YTD sales increased by 7% to 2.3 million tons versus 2.1 million tons in 2015
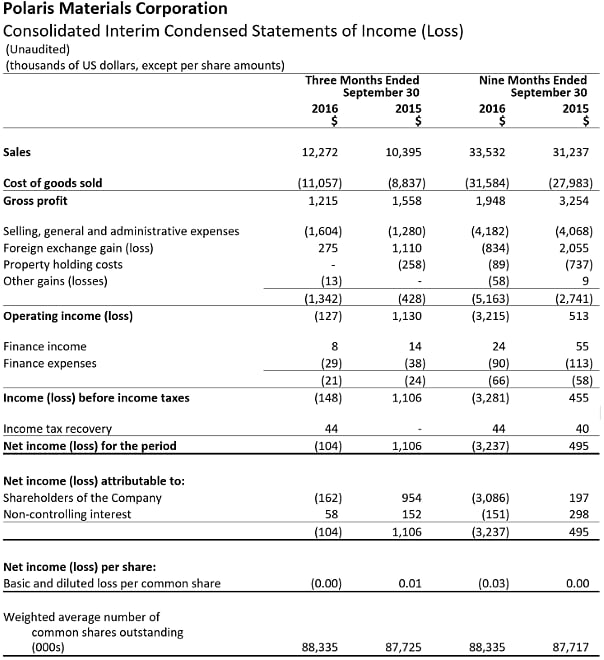
- Revenue of $12.2 million in was an increase of 18% over Q3 2015 revenue of $10.4 million
- Adjusted EBITDA of $1.5 million, or $1.90 per ton and gross profit of $1.2 million, or $1.50 per ton, represents our best quarter in 2016
- Maiden Mineral Resource estimate for Black Bear Project released on October 3, 2016; NI 43-101 technical report being finalized
The Company recorded net loss attributable to shareholders of $162,000 ($0.00 per share loss) during the three months ended September 30, 2016, compared to a net income attributable to shareholders of $954,000 ($0.01 income per share) during the three months ended September 30, 2015. Third quarter results reflect improved sales volumes versus 2015 with sales of 810,000 coming in just above the midpoint of our expectations for the quarter. The benefits of the increased volumes were offset by costs related to the ramp-up of the new Long Beach terminal, unfavourable impact of foreign exchange compared with the prior year, and non-cash corporate costs related to stock-based compensation. We expect gross margins will improve as volumes through Long Beach accelerate and we realize the benefits from our ongoing logistics costs improvement program. Customers and competitors continue to report a healthy construction market outlook in California, with the first signs of the benefits of the 2015 FAST Act now showing up in bid activity for infrastructure projects.
We continue to achieve sales milestones, as our US terminals recorded a one-day volume record on October 29, including over 9,300 tons supplied from our Long Beach Terminal. In San Francisco, a 10,900 cu yd concrete pour for a marquee mixed-use development, expected to contain up to 17,500 tons of aggregates, is scheduled for early December. The pour will be similar to the recent very successful Salesforce Tower foundation pour and will draw from our Richmond terminal as well as customers’ depot inventories. Our terminals continue to demonstrate that they can deliver against demanding large project construction schedules, and feedback from end users of our high performance concrete aggregates continues to be very positive.
We have initiated discussions with our Bay Area customers in respect of 2017 pricing and volume commitments, and are commencing data preparation for the scheduled 5-year review of our Strategic Alliance agreement with Cemex, due January 1, 2018. This agreement continues to be a cornerstone of our strategy in California, and we look forward to working with Cemex to take this opportunity to ensure that the agreement balances the needs of both parties now and in the future. We have also continued our efforts to identify new markets and new products where our marine delivery capability uniquely positions us to provide added value to our customers. We continue to negotiate with Hanson in respect of an extension to our supply agreement, originally signed in 2012 and currently scheduled to expire at the end of 2016.
We have identified an exciting opportunity that will expand the range of products at the Orca Quarry. Discussions are advancing regarding potentials sales for a fine sand product that has been exposed by previous mining activity of construction-grade materials. In support of this opportunity, Polaris recently approved a capital project to expand on our product range and stockpiling capability at the Orca quarry through the expansion of the existing surge tunnel and stacker system. The expanded load-out facility will allow us to stage the fine sand product as well as additional products for loading via our world-class shiploader, including fine sand from Orca as well as fill materials and manufactured sand and stone products from the Black Bear Project.
At our Black Bear Project, we announced a maiden NI 43-101 Mineral Resource estimate on October 3. Our current development plans for Black Bear call initially for a small-scale operation which could provide crushed rock and manufactured sand, or could supplement Orca gravel production and assist in product mix optimization. A Technical Report in support of the Mineral Resource Estimate will be filed in the fourth quarter.
Ken Palko, President and CEO, commented: “Sales volumes and revenues in Q3 2016 were robust and represent a solid increase from last year. We were also excited to announce the maiden Mineral Resource Estimate at Black Bear, which will position us to continue to advance the permitting process in conjunction with our First Nations partners, the provincial government and local stakeholders. We also approved an exciting capital project to expand our product stockpiling capabilities in anticipation of opportunities that we are developing for 2017. Q4 is shaping up to be another solid quarter and we are well on track for our full year operational targets, and we are also looking forward to progressing through the planning process for 2017.”
SUMMARY OF QUARTERLY RESULTS
The selected financial information set out below is based on and derived from the unaudited consolidated interim financial statements of the Company. For a more detailed table of quarterly results please refer to our Q3 2016 MD&A, which can be found on SEDAR or the Company’s website.
Selling price and fuel surcharge indices
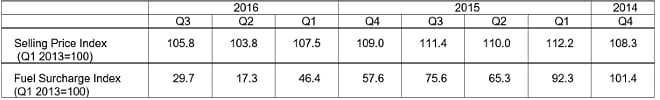
In the third quarter of 2016, the quarter-on-quarter average delivered selling price increased by 1.9% as a consequence of passing through higher shipping fuel surcharges from the second quarter of 2016, which reflected the increasing trend in the world crude oil price during the period.
Seasonality
The Company’s Orca sand and gravel quarry operates year-round, however, sales demand is seasonal due to the impact of poor weather conditions, particularly in the first (winter) quarter which have an impact on production volumes and demand for the Company’s products. As a consequence the Company’s financial results for any individual quarter are not necessarily indicative of results to be expected for that year. Sales and earnings are typically sensitive to regional and local weather, market conditions, and, in particular, to cyclical variations in construction spending.
THIRD QUARTER 2016, COMPARED TO 2015
Adjusted EBITDA
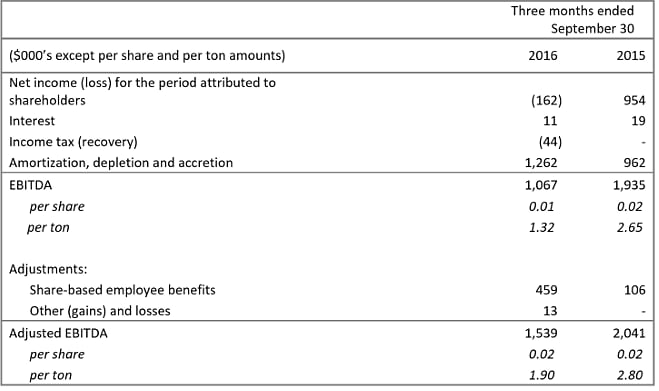
Adjusted EBITDA for the third quarter of 2016 of $1.5 million ($1.90 per ton) represented a decline of $0.5 million over the prior year comparative of $2.0 million ($2.80 per ton). Volume effects from increased sales were offset by increased terminal costs attributable to the ramp-up of our Long Beach terminal.
Sales of aggregates
Aggregate sales for the current quarter were 810,000 tons, a 11% increase over sales of 730,000 tons in the third quarter of 2015. Sales increased compared to the prior year due to increased delivered shipments into San Francisco and the Long Beach Terminal, which were offset by a decline in ex-quarry sales.
Revenue and pricing
Revenue for the three months ended September 30, 2016 increased by 18% to $12.3 million, compared with $10.4 million for the three months ended September 30, 2015. Revenue increased due to increased volumes, as well as an increased proportion of sales delivered to San Francisco and Los Angeles, as opposed to volumes sold ex-quarry.
Average selling price (“ASP”) during the current quarter of $15.15/ST increased $0.91/ST from $14.24/ST in the same period for 2015. Compared with 2015, price variance was unfavourable by 3% driven by a reduction in fuel surcharges. A favourable sales mix variance of 9% was due to increased sales to customers with delivered pricing, for a total change in ASP of 6%.
Revenue and ASP per ton are influenced on a quarter by quarter basis by base pricing, shipping fuel surcharges, overall market demand, the distribution of tonnage delivered to the various California terminals, and the varying percentage of delivered versus ex-quarry sales.
Cost of goods sold
Cost of goods sold per ton for the current quarter increased by $1.54 per ton to $13.65 compared to the cost of goods sold per ton for the same period in 2015 of $12.11. Higher delivery costs due to an increased proportion of sales to customers that include freight was the largest contributor to the increase, as well as the addition of higher unit costs for sales via our Long Beach terminal, which is a longer shipping distance and consequently has a higher unit freight cost.
Gross profit
During the third quarter of 2016 the Company’s gross profit was $1.2 million or $1.50 per ton, compared with a gross profit of $1.6 million or $2.13 profit per ton in the prior year period. The decline in gross margin was driven primarily by costs attributable to the ramp-up of our Long Beach terminal.
Selling, general and administrative costs
Current quarter selling, general and administrative (“SG&A”) expenses of $1.6 million, increased 25%, compared with $1.3 million during the same quarter in 2015. The increase is principally due to higher share-based employee benefits, a non-cash charge, which increased by $353,000 over the prior year due to units and options which fully vested on grant. Total SG&A during the quarter was 13.1% of sales compared to 12.3% of sales during 2015.
Net income (loss)
The Company recorded net loss attributable to shareholders of $162,000 ($0.00 per share loss) during the three months ended September 30, 2016, compared to a net income attributable to shareholders of $954,000 ($0.01 income per share) during the three months ended September 30, 2015. The decrease in year on year profitability was mainly attributable to a decline in foreign exchange gains.
CONFERENCE CALL AND WEBCAST DETAILS
The Company will host a conference call on Wednesday, November 9th, 2016 at 8:00 am Pacific Time (11:00am Eastern). Details to access the call live are as follows:
- Via telephone, toll free, by calling 1-888-390-0605 in North America or +1-416-764-8609 in Toronto.
- Via webcast at: http://goo.gl/rsxlYD
The webcast will be archived for 14 days following the call at the above-noted link. The conference call will also be recorded and available for replay until Wednesday, November 23, 2016. To access the replay, dial 1-888-390-0541 or +1-416-764-8677 and use Playback Passcode 576702# to hear the recording.
About Polaris Materials Corporation:
Polaris Materials Corporation is engaged in the development and operation of construction aggregate quarries in Canada to supply distribution facilities in the United States through coastal shipping. The Company's active construction aggregate interests consist of its Orca Sand and Gravel Quarry in British Columbia and two associated receiving terminals in Richmond and Long Beach, California. The Company also owns the Black Bear Project located in close proximity to the Orca Quarry, and a controlling interest in the Eagle Rock Quarry Project, located on the south coast of Vancouver Island.
For further information, please contact:
Nicholas Van Dyk
Vice President, Investor Relations and Corporate Development
Polaris Materials Corporation
Tel: (604) 915-5000 Ext. 111
info@polarismaterials.com
Cautionary Note Regarding Forward Looking Statements
This press release contains "forward-looking statements" and "forward-looking information" within the meaning of applicable securities laws. These statements and information appear in this document and include estimates, forecasts, information and statements as to management's expectations with respect to, among other things, the future financial or operating performance of the Company, including increases in gross margins, increases in sales volumes (including in the Long Beach market), shipments and selling prices, costs of production, capital and operating expenditures, requirements for additional capital, government regulation of quarrying operations, environmental risks, reclamation expenses, and title disputes, the Canadian dollar compared to the US dollar, increases in Californian construction activity and US infrastructure funding, statements regarding potential new customers and the development of Black Bear. Often, but not always, forward-looking statements and information can be identified by the use of words such as "may", "will", "should", "plans", "expects", "intends", "anticipates", "believes", "budget", and "scheduled" or the negative thereof or variations thereon or similar terminology. Forward-looking statements and information are necessarily based upon a number of estimates and assumptions that, while considered reasonable by management, are inherently subject to significant business, economic and competitive uncertainties and contingencies. Readers are cautioned that any such forward-looking statements and information are not guarantees and there can be no assurance that such statements and information will prove to be accurate and actual results and future events could differ materially from those anticipated in such statements. Important factors that could cause actual results to differ materially from the Company's expectations are disclosed in the Company's continuous disclosure documents which are filed with Canadian regulators on SEDAR (www.sedar.com), including under the heading "Risks and Uncertainties" in the Company's Annual Report and under the heading "Risk Factors" in the Company's Annual Information Form. Such factors include, amongst others, the effects of general economic conditions, changing foreign exchange rates and actions by government authorities, uncertainties associated with legal proceedings and negotiations, industry supply levels, competitive pricing pressures, mineral resource and reserve estimates and the timing and development of the Black Bear project. The Company expressly disclaims any intention or obligation to update or revise any forward-looking statements and information whether as a result of new information, future events or otherwise, except as required by applicable law. All written and oral forward-looking statements and information attributable to us or persons acting on our behalf are expressly qualified in their entirety by the foregoing cautionary statements.
Non-IFRS Measures
EBITDA and Adjusted EBITDA
EBITDA, adjusted EBITDA, EBITDA per share and adjusted EBITDA per share (“EBITDA Metrics”) are non-IFRS financial measures. EBITDA and EBITDA per share represent net income, excluding income tax expense, interest expense and amortization and accretion. Adjusted EBITDA and adjusted EBITDA per share better reflects the underlying business performance of the Company by removing certain non-cash adjustments from its calculation of EBITDA and EBITDA per share. The Company believes that the EBITDA Metrics trends are valuable indicators of whether its operations are generating sufficient operating cash flow to fund working capital needs and to fund capital expenditures. The Company uses the results depicted by the EBITDA Metrics for these purposes, an approach utilized by the majority of public companies in the construction materials sector. The EBITDA Metrics are intended to provide additional information, do not have any standardized meaning prescribed by IFRS and should not be considered in isolation or as a substitute for measures of performance prepared in accordance with IFRS. These measures are not necessarily indicative of operating profit or cash flow from operations as determined under IFRS. Other companies may calculate these measures differently.
The following table reconciles these non-IFRS measures to the most directly comparable IFRS measure.